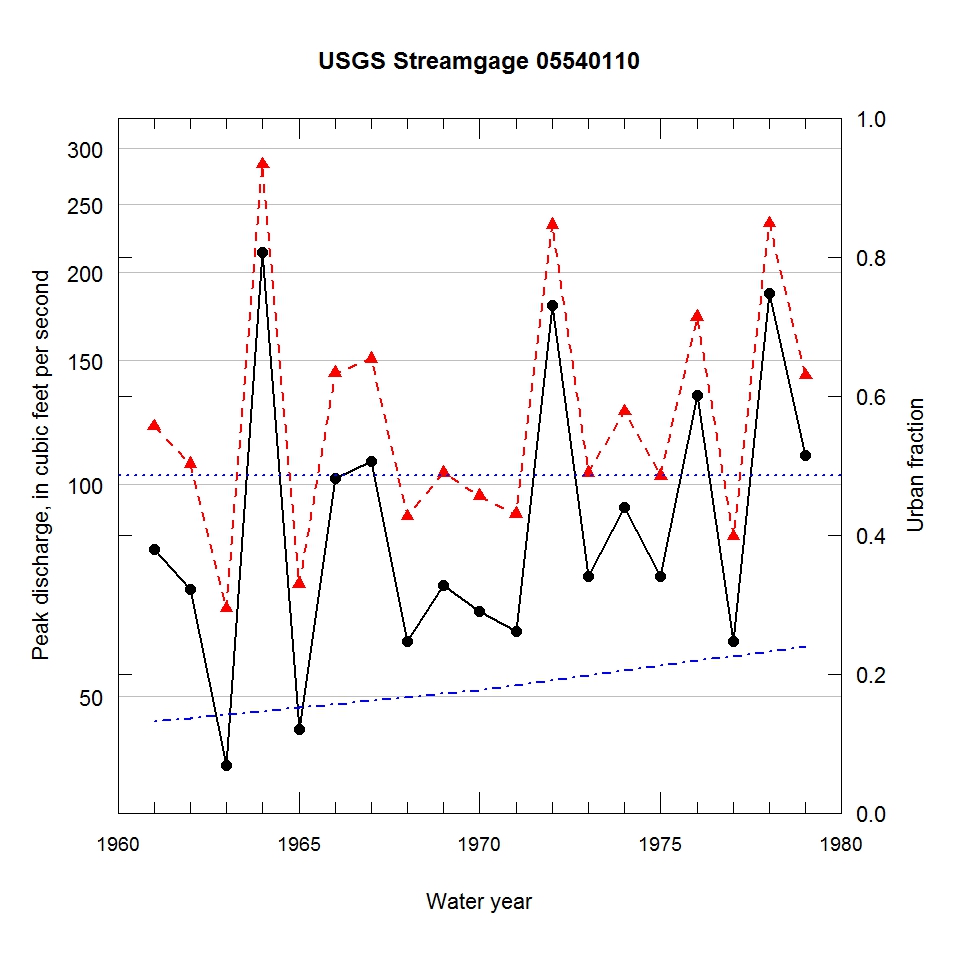
Observed and urbanization-adjusted annual maximum peak discharge and associated urban fraction and precipitation values at USGS streamgage:
05540110 FERRY CREEK AT WARRENVILLE, IL


| Water year | Segment | Discharge code | Cumulative reservoir storage (acre-feet) | Urban fraction | Precipitation (inches) | Observed peak discharge (ft3/s) | Adjusted peak discharge (ft3/s) | Exceedance probability |
| 1961 | 1 | -- | 0 | 0.131 | 1.352 | 81 | 121 | 0.508 |
| 1962 | 1 | -- | 0 | 0.136 | 0.301 | 71 | 107 | 0.611 |
| 1963 | 1 | -- | 0 | 0.141 | 1.314 | 40 | 67 | 0.871 |
| 1964 | 1 | -- | 0 | 0.146 | 1.797 | 214 | 285 | 0.047 |
| 1965 | 1 | -- | 0 | 0.152 | 0.135 | 45 | 72 | 0.838 |
| 1966 | 1 | -- | 0 | 0.157 | 1.344 | 102 | 144 | 0.362 |
| 1967 | 1 | -- | 0 | 0.162 | 1.349 | 108 | 151 | 0.327 |
| 1968 | 1 | -- | 0 | 0.167 | 1.389 | 60 | 90 | 0.730 |
| 1969 | 1 | -- | 0 | 0.172 | 0.587 | 72 | 104 | 0.628 |
| 1970 | 1 | -- | 0 | 0.177 | 1.439 | 66 | 96 | 0.684 |
| 1971 | 1 | 2 | 1500 | 0.184 | 0.362 | 62 | 91 | 0.724 |
| 1972 | 1 | -- | 1500 | 0.191 | 2.184 | 180 | 234 | 0.087 |
| 1973 | 1 | -- | 1500 | 0.198 | 1.356 | 74 | 104 | 0.630 |
| 1974 | 1 | -- | 1500 | 0.205 | 1.227 | 93 | 127 | 0.466 |
| 1975 | 1 | -- | 1500 | 0.212 | 1.021 | 74 | 103 | 0.640 |
| 1976 | 1 | -- | 1500 | 0.219 | 1.108 | 134 | 173 | 0.223 |
| 1977 | 1 | -- | 1500 | 0.226 | 1.257 | 60 | 84 | 0.766 |
| 1978 | 1 | -- | 1500 | 0.233 | 1.949 | 187 | 235 | 0.087 |
| 1979 | 1 | -- | 1500 | 0.240 | 0.924 | 110 | 143 | 0.370 |

